Analytics
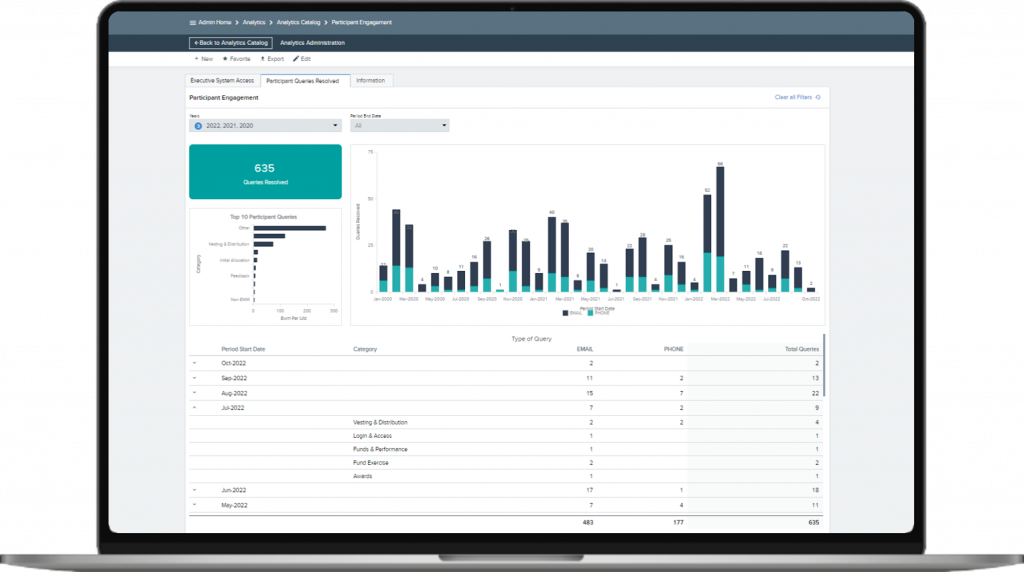
Our Analytics Dashboard is focused on providing transparency of aggregate compensation data stored in our system, centered around transactions, balances and other key metrics within our product offering. Engineered in house by our data experts, our analytics dashboards provide intuitive filtering of both graphical and detailed statistics which can be easily extracted to support your management reporting needs.
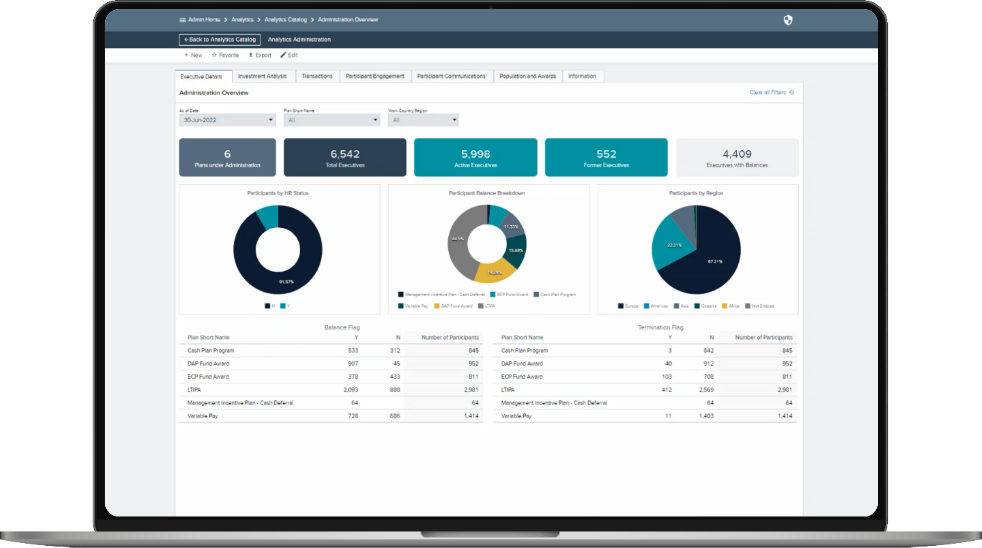
Harness the Power of your Data
- Dynamic Visualizations of your most important metrics
- Meaningful Insights to assist decision making
- Up-to-date Analytics
- Intuitive Filters
- Consistent, Quality Data
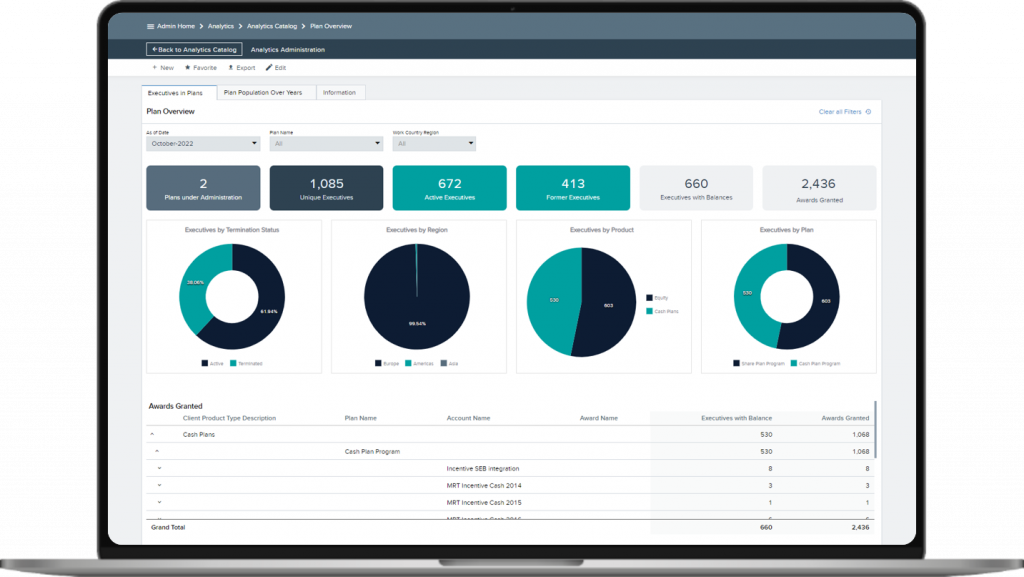
Plan Overview
Plan Overview will display high level plan, participant and award counts based on all plans currently active in the EWM System.
View this data based on the end of month statistics for your selected month. Various filter parameters allow you to view the data based on your selected inputs.
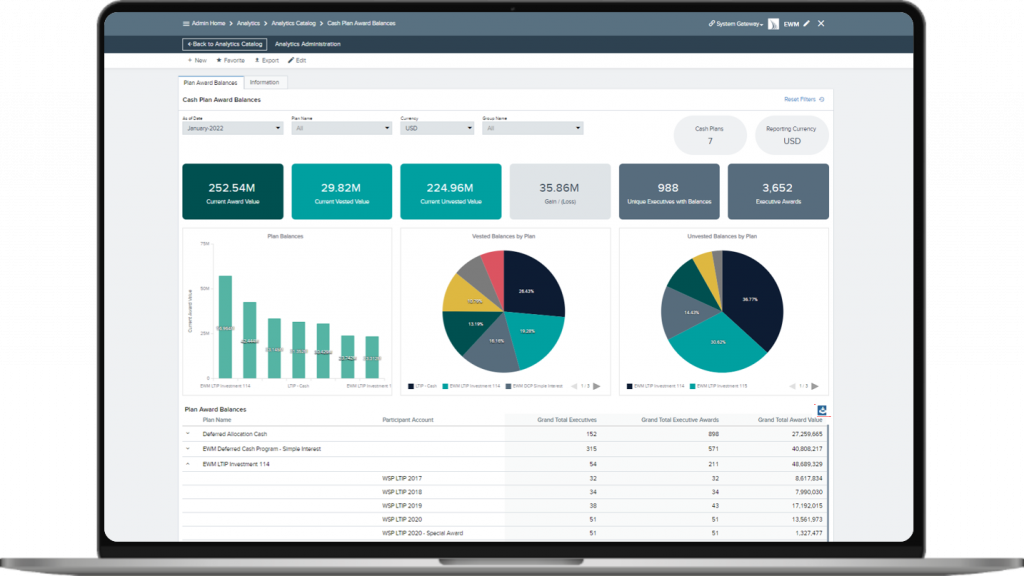
Product Plan Balances
Product plan balances will show the outstanding end of month value in each plan and award based on your selected inputs.
- All widgets provide the ability to extract the raw data into excel if needed.
- Balance and Transaction values are available in USD as well as a preferred currency.
Product Plan Transactions
Product plan transactions will show an overview of the total grants, distributions and forfeitures for your selected date range.
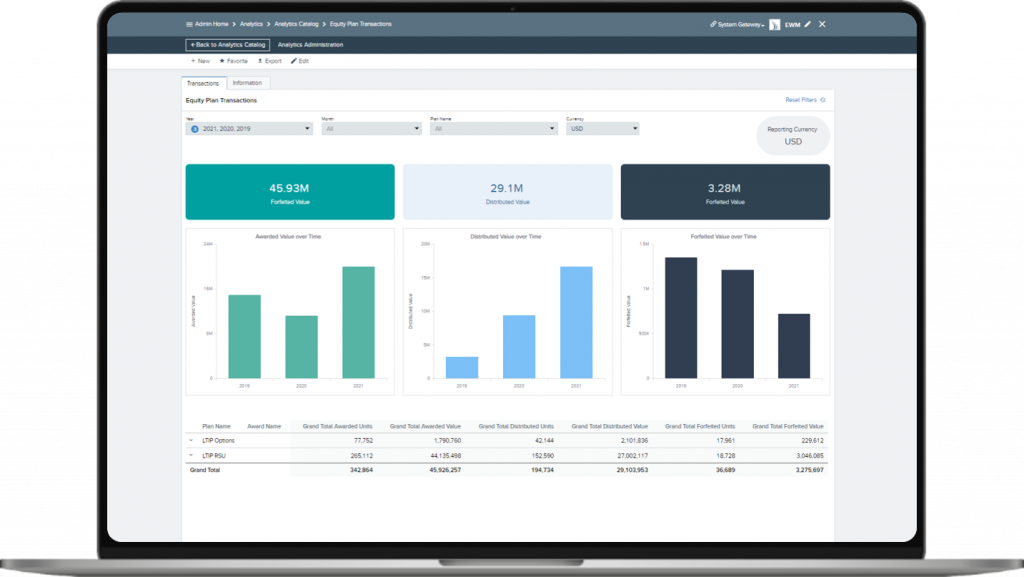
Whether you’re in need of visually appealing management reports, amortization and employee mobility tracking, or are looking to dive deep into analysis of your plan and employee population data, your information has never been more accessible with our Analytics Dashboard.